RHF

RHF Impact Leaderboard

Whitepaper

How the Impact Leaderboard Works

The leaderboard is a structured way to compare research funders by the observable impact of the work they support. It is not a popularity ranking, a budget ranking, or a claim that one number captures every kind of scientific value. The goal is to make the evidence visible, comparable, and easy to challenge.

Step 1

Gather public evidence about a funder and its research portfolio.

Step 2

Translate that evidence into five normalized pillar scores.

Step 3

Blend the pillars into one composite impact score.

Step 4

Show efficiency and trend signals separately so they do not distort the core score.

The Five Pillars

Every funder is described as a profile across five dimensions. This makes it possible to distinguish different kinds of impact: a funder can be excellent at academic output, unusually strong in translation, or valuable because it builds an ecosystem that others rely on.

Academic

How strongly a funder supports research output, quality, and scholarly visibility.

Translation

How often funded work appears to move toward practice, policy, clinical use, or applied adoption.

Innovation

How much the portfolio is connected to new technologies, patents, ventures, or field creation.

Societal

How visible the funder is in public benefit, policy relevance, health, community, or mission outcomes.

Ecosystem

How broad, durable, and connected the funder is across institutions, fields, partners, and programs.

Composite Impact

The composite score combines the five pillars into a single view for sorting and scanning. Academic and translation signals carry the most weight because research output and movement into use are the most consistently observable across funders. Innovation, societal relevance, and ecosystem strength add balance so the table does not reward publication volume alone.

Impact Per Dollar

Impact per dollar is an efficiency lens. It asks how much observable impact appears for the amount of funding deployed. It is shown separately from the composite score because efficiency can favor smaller or narrower funders, while the core impact score reflects absolute contribution and breadth.

Trending Score

Trending captures direction of travel. A funder with a lower current score may still be accelerating quickly, while a large established funder may have a high absolute score but flatter momentum. Keeping trend separate makes that distinction visible.

Confidence

Confidence reflects how complete and reliable the available evidence is. A score based on sparse public information should be treated as provisional, even if the current estimate looks high. The dashboard is designed to expose those limits instead of hiding them.

How to Read the Table

Use score for rank

The main score is the broadest comparison of overall research-funding impact.

Use pillars for shape

The pillar bars explain why two funders with similar scores may be strong in different ways.

Use efficiency carefully

Impact per dollar is useful for context, but it should be read with confidence and mission scope.

Evidence and Scoring Method

The sections below expand the table guidance into the working methodology. They keep the operational detail needed to interpret the ranking while leaving out internal file paths and script-level implementation notes.

What Counts as Evidence

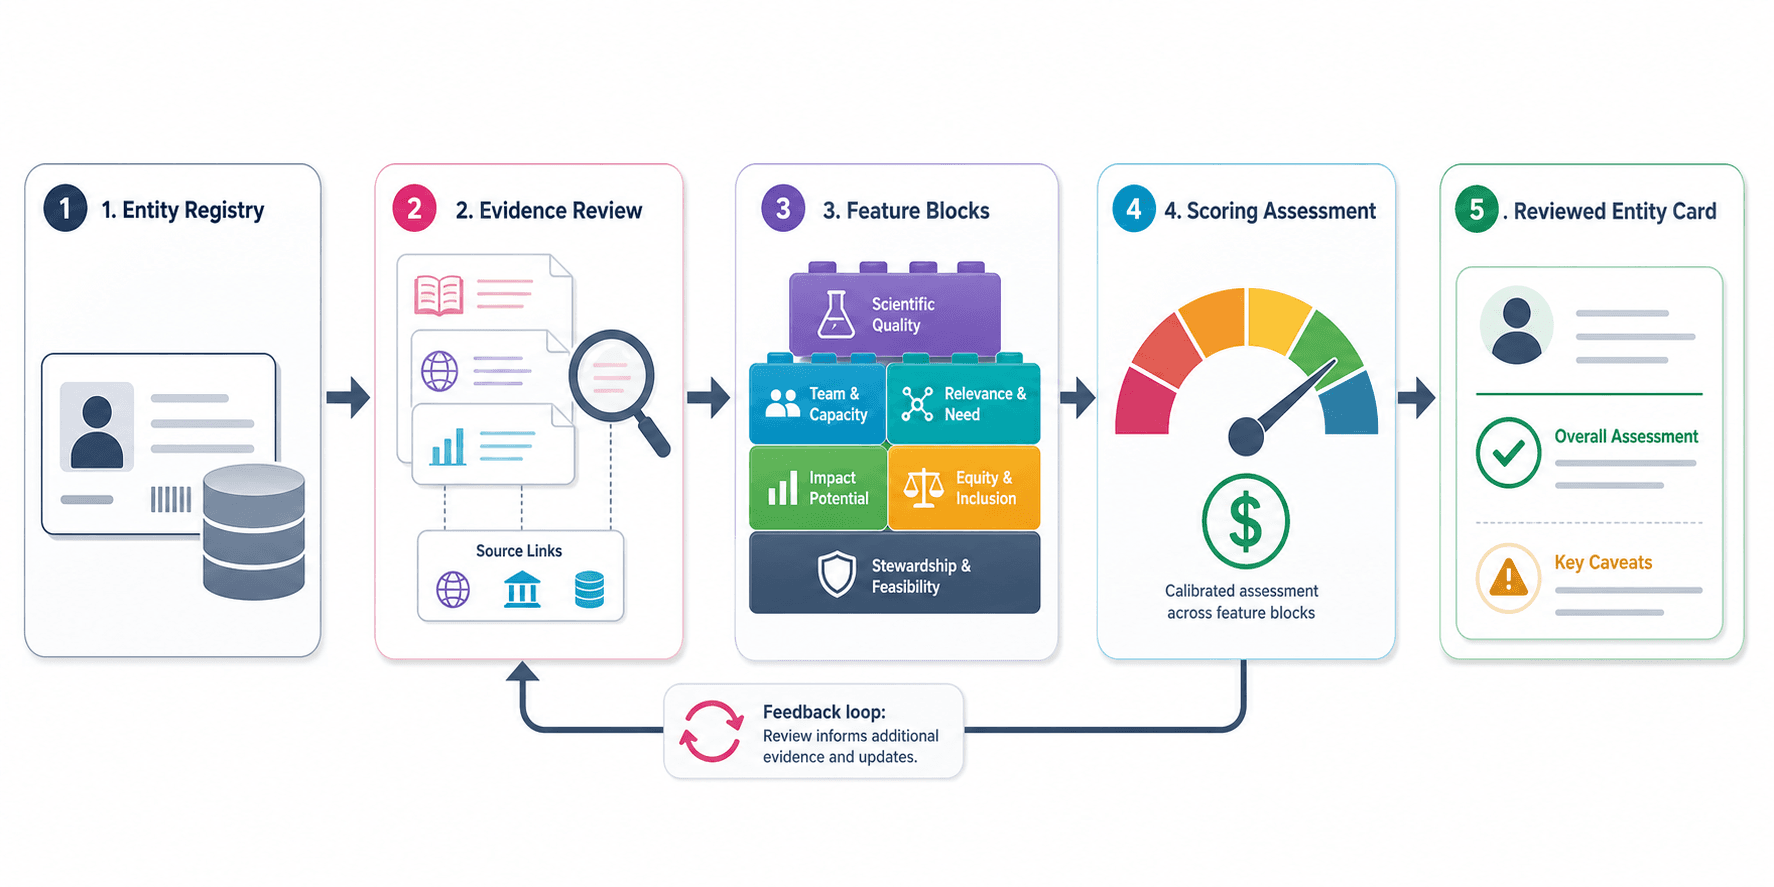
The system combines public funder identity records, grant and award signals, publication-visible funding links, funder websites, annual reports, tax filings, benchmark notes, and manually reviewed evidence packs. Strong rows usually have a recognizable funder identity, a clear denominator such as grants, budget, program expense, or R&D spend, and observable outputs such as funded publications, clinical translation, policy uptake, patents, products, field-building, or public-benefit outcomes.

Identity Resolution

A ranking row must represent one funder as cleanly as possible. The matching process prefers durable identifiers such as ROR, OpenAlex funder IDs, and FundRef/Crossref IDs when available, then falls back to normalized names, aliases, parent organizations, and conservative fuzzy matching. This is why some rows represent a parent funder, while others represent a foundation, agency, institute, program, or corporate research arm.

Discovery Pool

The broad discovery pool starts from active organizations that appear to function as funders or research-supporting institutions. It includes philanthropic, nonprofit, government, university, health, facility, and corporate funders. Discovery readiness is not the same as impact: it only tells us whether an entity has enough identity, website, alias, and funder-reference coverage to be worth scoring.

Portfolio Evidence

Where OpenAlex or similar metadata links works to funders, the system uses recent funded works, all-time output, award counts, field coverage, recipient institutions, field concentration, and growth trends. This is strongest for publication-visible research funders and weaker for funders whose impact happens through services, policy implementation, infrastructure, community programs, patient outcomes, or private-sector products.

Feature Building

Each funder is converted into a structured feature profile. The profile separates identity and provenance, portfolio scale, field breadth, recipient reach, program topics, funding instruments, flagship programs, partners, and qualitative signals. Text-derived signals are treated as proxies, not proof. They help distinguish strategy, transparency, translation readiness, social mission, and innovation intent when direct quantitative data is not yet available.

Evidence Confidence

Confidence is a scoring control, not just a label. Rows with stronger identity coverage, source coverage, portfolio evidence, topics, websites, and reviewed evidence receive more trust. Sparse rows are intentionally compressed so they cannot rank as confidently as well-supported rows. This keeps the leaderboard useful while making uncertainty visible.

Normalization

Raw counts are not compared directly. Publication counts, award counts, citation signals, patents, recipient counts, and similar fields are normalized across the current dataset. Heavy-tailed values are dampened so a very large funder does not overwhelm the table by size alone. Bounded shares and rates stay on their natural scale.

Pillar Scoring

Academic score rewards research output, award activity, and field coverage. Translation rewards movement toward policy, practice, clinical use, recipient reach, and applied uptake. Innovation rewards patents, product or technology signals, originality, and growth. Societal score rewards public-benefit mission, policy relevance, health, community, and outcome signals. Ecosystem score rewards breadth across fields, institutions, partners, and durable research capacity.

Composite Ranking

The main score blends the five pillars with the highest weight on academic and translation evidence, followed by innovation, societal, and ecosystem signals. The composite is meant for sorting and scanning, while the pillar profile explains the shape of a funder. Two funders can have similar totals for very different reasons.

Top-Down and Bottom-Up Views

The project keeps two complementary views. The top-down view starts from normalized grant and publication records and provides a stable baseline. The bottom-up view starts from funder entities and evidence packs, making it better for philanthropy, nonprofit, corporate, facility, and program funders that do not always appear cleanly in publication metadata. The combined dashboard blends these views when there is a reliable match.

Benchmarking

Benchmark rows are evidence-backed examples used to challenge and calibrate the raw score model. They are not simply the current top scorers. A useful benchmark set includes strong funders, sparse funders, pillar specialists, country and type coverage, and boundary cases where it is unclear whether an organization should be treated as a funder, operator, or both.

Calibration

Calibration compares raw pillar scores with benchmark targets and tests whether simple transformations reduce error. The current approach is conservative: it caps large score shifts and treats calibration as an experiment until benchmark anchors are reviewed. Calibrated outputs should be read as diagnostics unless they have passed source review and stability checks.

Impact Per Dollar

The efficiency layer asks whether there is usable evidence linking spend to outputs or outcomes. Stronger cases have a denominator such as grantmaking, program spend, budget, R&D expense, or audited financials, plus a numerator such as publications, clinical results, product adoption, policy impact, beneficiaries, environmental gains, or verified economic outcomes. When either side is weak, the efficiency score stays exploratory.

Known Limits

The ranking is evidence-sensitive. Publication metadata misses many real-world outcomes, private entities often lack public denominators, old or acquired organizations may only have historical evidence, and text signals can overstate intent if not checked against outcomes. Confidence, caveats, and source notes are therefore part of the product rather than footnotes.

How to Use the Ranking

Use the table to identify promising funders, compare pillar shapes, find evidence gaps, and prioritize deeper review. Do not treat a high score as a final qualitative judgment. The best use is iterative: inspect sources, challenge caveats, improve the denominator and numerator evidence, and then rerun the scoring layer.

Current Reading Rules

Treat sparse rows as provisional

A funder can have an estimated score before the evidence is mature. Low confidence, weak denominator evidence, or thin source coverage means the row should be reviewed before being cited.

Compare like with like

A public agency, a disease foundation, a university, a corporate R&D group, and a private philanthropy can all create impact, but their evidence trails differ. Pillars and confidence help keep those differences visible.

Read caveats as part of the score

Caveats explain whether the row depends on proxies, historic data, parent-company reporting, estimated spend, incomplete publication links, or qualitative source evidence.

Use benchmarks to improve the model

Benchmarks and calibration are used to find places where raw feature scores disagree with source-backed judgment. They are a review tool, not a shortcut around evidence.